Urban spaces are usually identified through the borders and boundaries drawn on a geographical map. City lines, streets and corridors are often worked out in great detail. Today, however, another city has emerged, which cannot be detected directly from physical characteristics, with borders that are no longer easy to identify – a computational city.
Cities today are digital-physical hybrids. Parts of the city exist in our computationally mediated imagination and other parts are experienced through our bodies. As such the city resembles a garden of microchips, a metaphor that architect Toyo Ito already used almost ten years ago, before the advent of smart cities. He saw the city as made up not of immobile objects but of various information flows influenced by the design of infrastructure and flows, such as water, air, human beings, traffic and different forms of energies. Today we see an extra layer of various energies added to these flows – from the emails, messages, credit card payments and cookies stored on our smartphones to the data sets emitted from sensors in sewers or cameras on lampposts. The computational city is flowing with digital information – information that is mediated by infrastructure.
Geographical maps fail to represent what geographers often refer to as territories.
The point of Ito’s metaphor is that the design of infrastructure and information cannot be detached from one another. One way to govern a city’s infrastructure, and consequently its information, is to tie it back to the geographical boundaries of a map. However, geographical maps fail to represent what geographers often refer to as territories, areas that emphatically fall outside a geographical map. As Jorge Luis Borges proclaims in the famous short story ‘On Exactitude in Science’1, the art of cartography continuously fails to map a territory. Even when it tries, it quickly becomes apparent that such a map is of no use. In that sense, the territory is that which always escapes the map. It spills out of any mapping exercise.
The history of political conquest has shown that a well-delineated geographical map is a great tool for power. It is no surprise that states are key sponsors in the development of maps, as tying information and infrastructure to a non-territorial abstraction, the state map, bears great political consequences. Thus, aligning information with territories may offer an interesting political intervention, one that attempts to transgress the usefulness of geographical maps for coercion and power. This article aims to show that there are other ways in which the computational city can be drawn, imagined and developed. Rather than tacking data onto an established geographical map, digital cartographers can create territorial experiences.

_-_Geographicus_-_AmeriqueSeptentrionale-covensmortier-1708.jpg)
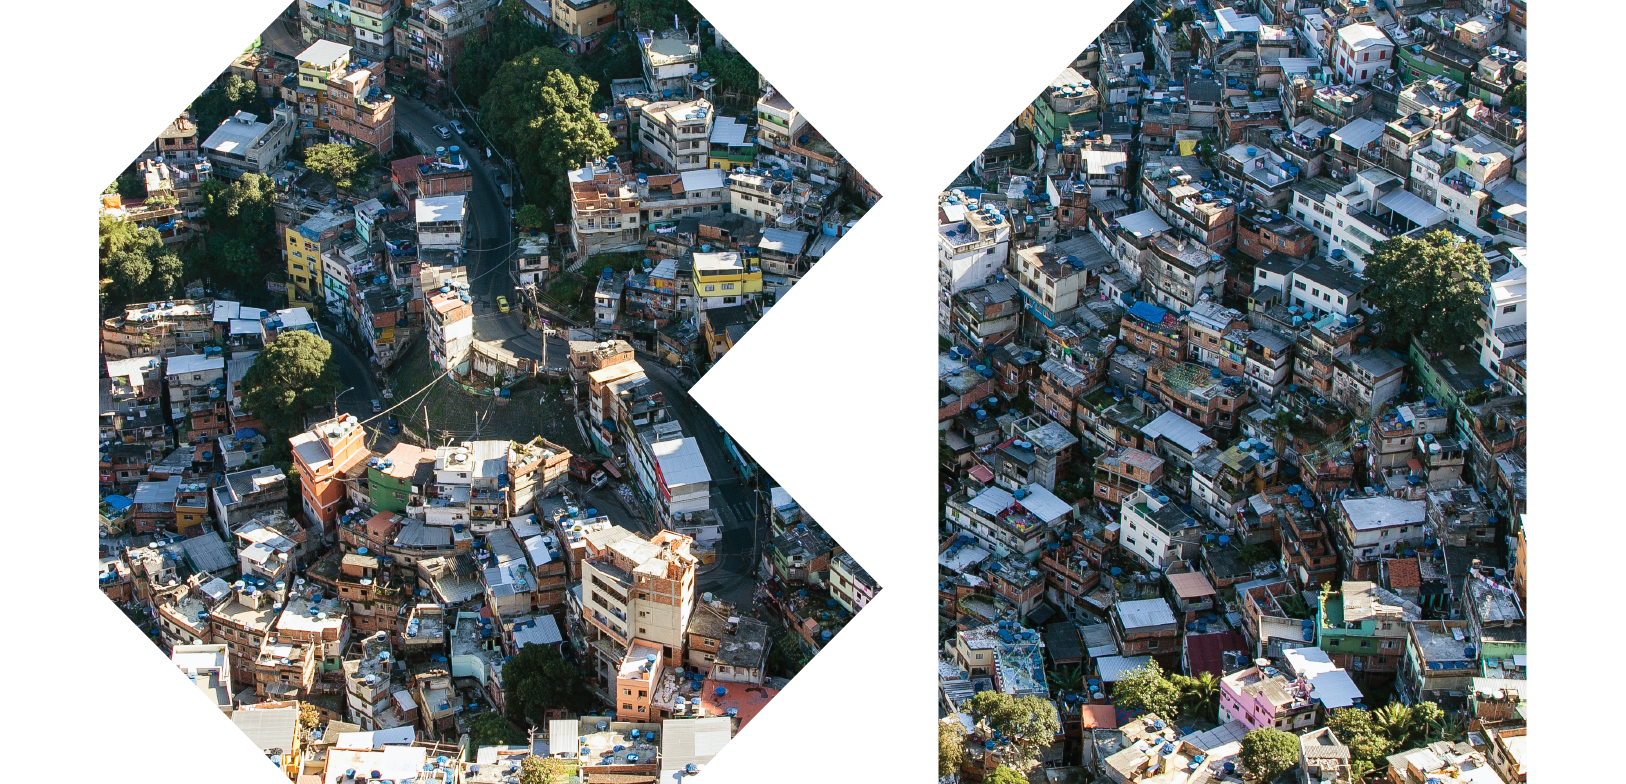
The digital cartographer in this story is Carlos Pedro, an experienced Census Bureau worker whose knowledge and ingenuity baffled mapping software giants such as Google and Microsoft. He created an app, but the impression it left on the community was anything but trite. Pedro was one of the first people able to map the supposedly impossible favelas in Brazil. Born and raised in a favela called Rocinha, a place founded by construction workers, Pedro realized the difficulty of mapping a place as complex and rich as the street where he grew up. He understood that relying on visual geographical maps was futile. The terrain of the favelas doesn’t lend itself to being photographed by mapping satellites; even the all-encompassing Google Maps has a limited view of such areas. Rocinha is a place with numerous tunnels that can’t be seen from above. The visible objects can often be confusing – a street, for example, can easily be mistaken for a concrete slab. What’s more, the materials used in the favelas are brittle, temporary and ever changing. Therefore, any mapping system would have to facilitate some form of updating. Because of these conditions, Rocinha is a place that is always under construction, where there are no addresses. This problem is typical across all of Brazil’s slums. Since the land is not tenured the government is not required to create streets. It is also not required to provide infrastructure, which would allow for services such as the distribution of mail.
Pedro knew that a traditional map would not work in this area. Instead of representing the streets of Rocinha visually, he decided to collate a set of instructions for each address by describing the route to reach it. He and his partners also set up a postal system that distributes the mail using these instructions and that can be updated. For the instructions or directions to make sense, however, Pedro had to describe and define each structure along the way, whether natural or built, using a form of language that mailmen could understand and update. Its vocabulary is derived from naming conventions and words used in the favela. For example, a blind alley with less than twelve homes is called a ‘condominium’. By following the structures in a sequence, such as ‘wall, stone, henhouse, store, house, building’, the mailmen get to their destination and the app allows them to decipher the structures as well as alter the route description according to the most current situation.
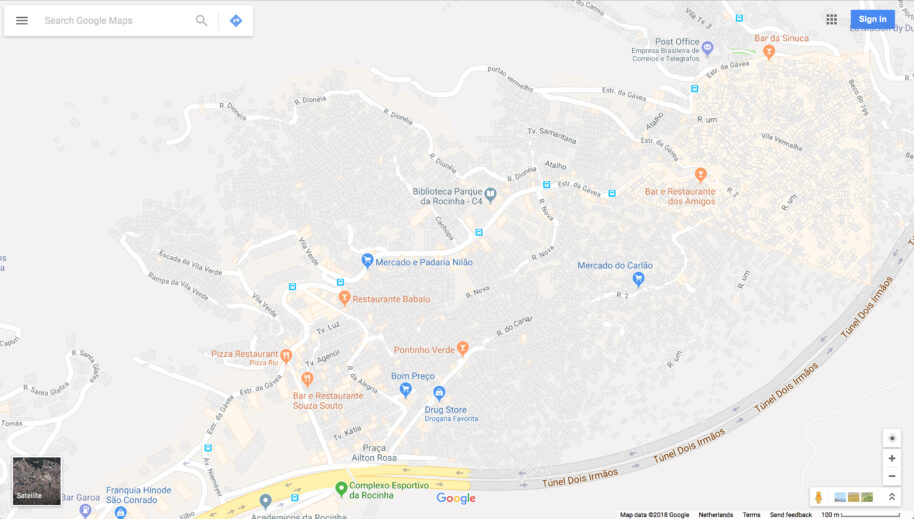
It’s not difficult to see why Pedro’s Friendly Mailman defies the likes of Microsoft2 and the United Nations3 who have, on separate occasions, attempted the favela mapping exercise without success. Both organizations realized the futility of geographical mapping early on: both their systems depended on the work of volunteers manually entering street names into their smartphones. Despite recognizing the limitations in visualizing the favelas, these solutions remain based on collating street names as a means to enhance the geographical map. They are unable to conceive of an idiosyncratic territorial paradigm that might require new type of infrastructure – a tailored postal system for instance.4
Friendly Mailman lies at the opposite end of the spectrum of simulation software to for example Improbable’s operating system, SpacialOS5, which uses algorithms and big data to create 3D city models, programmed specifically to influence policy-making and the complex governance of cities. Simulation software such as SpacialOS6 draws a city map that doesn’t lend itself to incorporating idiosyncrasies. The problem of course is that this type of simulation software aims to replicate the master plan design of cities and is limited as such, especially when it comes to the more precarious aspects of the terrain it maps. Instability and oddities are problems that such software cannot process. Thus, when compared to Friendly Mailman, SpacialOS appears disconnected from the language and culture of the city. It takes a structural, master-plan approach to its mapping, while Pedro’s map uses a set of alterable instructions, or algorithms, written with the aid of the language of the people who live in this territory.
From a design perspective, it’s important to see that not all information in the garden of microchips can or should be represented as a geographical map. The political and social complexities of territories like the favela are not limited to geography. Even in situations where it is possible to place information on a map, designers have a responsibility to pay attention to and represent the nuances in the data and information accurately and appropriately; Friendly Mailman is exemplary in this regard. Pedro didn’t align his map to the geography of the place, he traced a new territory. He didn’t simply design a map but an algorithm that maps what matters and represents an unorganized territory that is not formally developed by the state.
Creating a nuanced design like Pedro’s requires an intimate knowledge of infrastructure but more specifically, an understanding of where that infrastructure can be disrupted. Designers need to find out how operating systems like SpacialOS work, but more importantly how they don’t work. In other words, they need to hack operating systems. Hacking in this sense can only occur off the state-sanctioned geographical map.
The political and social complexities of territories like the favela are not limited to geography.
The idea that a city is an operating system is addressed by architecture theorist Keller Easterling in her book Extrastatecraft. She describes the role of computational and telecommunication infrastructure in shaping cities, by the forming of enclaves, for instance. Easterling is interested in the way the consequences of infrastructure don’t always match the intent with which it was created. She sees this broken promise as an opportunity to move and direct something as vast and structured and as computational infrastructure. One example she gives is the story of highways, which begins as a narrative about freedom, and ends with congestion. Another example is the ARPANET network, created with the intention of remaining hidden, but which has since expanded to become the highly visible and extremely well-known Internet. She shows that most of the outcomes of infrastructure diverge from the initial narrative they were built on. In other words, infrastructure has a complex agency that cannot be predetermined and is somehow malleable. The utilization of Google’s infrastructure in the Russian email hacking attempts7 is a more recent example. Easterling is adamant that computational infrastructure can be hacked.
In order to do that, Easterling claims, we need to identify and address the different active forms that infrastructure takes. An example of an active form that she discusses at length is the multiplier. ‘The house was not a singularly crafted object but a multiplier of activities’,8 she explains. The multiplier is a form of mass production applied to infrastructure. In her view, instead of producing a thousand houses or apartments individually, developers produce the parts to a thousand houses on an assembly line. The operation of building a house is thus divided into small tasks manageable in a factory.
The way to influence multipliers is to learn the limits of their operation. Multipliers make many types of construction possible but they also render many things impossible. Rather than intervene in the things that are made possible the designer should discover the opportunities left in the cracks in the system. Easterling remarks that most designers and architects are trained to look at objects rather than the interplay of active forms. Designing for active forms is thus working with the spatial variables of infrastructure rather than concentrating on formal objects, or the master plan, and tacking on movement or kinetics at the end.
What appears with the rise of the computational city is a means for designers and coders to bend infrastructure, institutions and maps that are associated with power structures.
Visualizing data on a geographical map is an example of such object-focused design. The object in this case is the map, which is made dynamic by using the data. Such a design methodology takes the designer away from Toyo Ito’s information flows. Territories on the other hand represent an area of variable spatiality. They are impossible to define, adhere to their own laws, and require a constant effort to maintain. In fact, due to their variability, territories function well as active forms in the shaping of computational infrastructure.
Easterling discusses examples of territories referred to as free city zones. These zones were historically manufacturing warehouses built on trade ports, however, recently they have become seemingly apolitical yet highly powerful city enclaves. The United Nations promotes zones as a way for developing countries to enter the global market place. In that sense, they house and promote the ideals of global capital. The zone is a strange mix of lawlessness and urban progress. It’s a place where laws are weakened to promote trade, capital’s state of exception. Easterling claims that the zones are a potential multiplier which offers designers an opportunity to intervene and trace these zones not to visualize them on a map but to expose them as a territory.
In conclusion, what appears with the rise of the computational city is a means for designers and coders to bend infrastructure, institutions and maps that are associated with power structures. Whether it’s Carlos Pedro’s app which allows users to traverse a lawless terrain or the transgressive nature of Keller Easterling’s free city zones which invites designers to play with the active forms of infrastructure space, information flows need not adhere to constructed boundaries and rigid objects. In order for the activist designer to play with these active forms or enable users to experience territories, he or she must find the cracks and the infrastructure loopholes, loopholes that are more easily transgressed with the design of information flows than with object-focused design.
- Jorge Luis Borges and Andrew Hurley, Collected Fictions (London: Penguin Books, 1999). ↩
- The AI Blog (2017) Bing’s collaborative Na Área project helps visitors discover more of Brazil’s favelas – and gives locals a digital boost – The AI Blog. Online. Available at: blogs.microsoft.com (accessed 27 July 2018). ↩
- UNICEF (2017) In Brazil, adolescents use UNICEF’s new digital mapping technology to reduce disaster risks in the favelas. Online. Available at: unicef.org (accessed 1 July 2017). ↩
- Recently Google started a project named ‘Rio: Beyond the Map’ which aims to tell the story of the people of favela. The project is comprised of an impressively designed website that hosts video diaries of local characters walking the favelas with Google cameras. Google Cultural Institute. (2017). Rio: Beyond the Map – Google Arts & Culture. [online] Available at: google.com (accessed 2 Jun. 2017) ↩
- Ltd., I. (2017) Improbable. Online. Available at: improbable.io (accessed 2 June 2017). ↩
- Ibid. ↩
- Franceschi-Bicchierai, L. (2017) Russian Hackers Are Using Google’s Own Infrastructure to Hack Gmail Users. Online. Available at: motherboard.vice.com (accessed 26 May 2017). ↩
- Keller Easterling, Extrastatecraft: The Power of Infrastructure Space, (London: Verso, 2016), p. 82. ↩